统计学
统计学
概述
什么是统计学
研究量化数据的方法的科学
Statisticsis the study of methods for dealing with quantitative information (data).
从数据中获得信息和知识
分为
- Descriptive Statistics
- 制作图表
- Explorative Data Analysis 分析数据得出结论
- Inductive Statistics(inferential statistics)
- 研究数据间的关系
- 预测未来趋势
统计学基本概念
Statistical units统计单元
Objects on which data is observed 被研究数据的对象
Population
所有需要的统计单元的集合
- 可以有限(finite),无限(infinite),假设的(hypothetical)
Subpopulations
sub set of the population
Sample
Actual subset of the population surveyed
Characteristic/variable/features
Quantity of interest observed on a statistical unit与统计有关系的量
如 Rent index: living space, building age
Characteristic value
上面一个概念具体的值
Feature Types and Scales
根据大小分类feature
Nominal scale
if its expressions are names or categories that cannot be put into a meaningful orderOrdinal scale
if its expressions can be ordered, but no meaningfully
例如feature "Do you need statistics in your current job?" (constantly, frequently, occasionally, never)
Cardinal scale(metrical)
if its expressions are numbers and their distances can be interpreted meaningfully
sale level 决定一个量是如何被测量的
根据量化的分类
- Qualitative feature
- indicates a quality or a membership of a class
- has a finite number of expressions
- is at most ordinally scaled
- Quantitative feature
- Reflects an intensity or extent
- Can be measured by numbers
其他分类
离散,连续
如何收集数据
实验 Experiment
methodically designed investigation for the empirical acquisition of data
调查 Survey
collecting data that in principle already exists
调查的类型
Primary statistical survey
Collection of data specifically for current issues
Secondary statistical survey
Use of existing original data for new questions
Tertiary statistical survey
Use of already existing, compressed data (e.g. mean values) for new questions
##统计学基本概念
频率Frequencies
考虑一个变量 \(X\), 它由统计单元,统计值为 \(x_1, ..., x_n\)
其中 \(x_1,..,x_n\) 叫源数据(raw data/original list)
绝对频率 Absolute frequencies
统计每个值出现的次数

用
设 \(a_1, .. a_k\) 是不同的值,我们用 \(h_j = h(a_j)\) 表示绝对频率

相对频率 Relative frequencies
统计这个值出现的次数占总次数的比例

用 \(f_j=f(a_j)=h_j/n\) 来表示
其中 \(f_1,f_2,...f_k\) 成为相对频率分布relative frequency distribution, 有 \(\sum _{j=1} ^{k} f_j= 1\)
分类
可以把频率列一个表来分析

图表
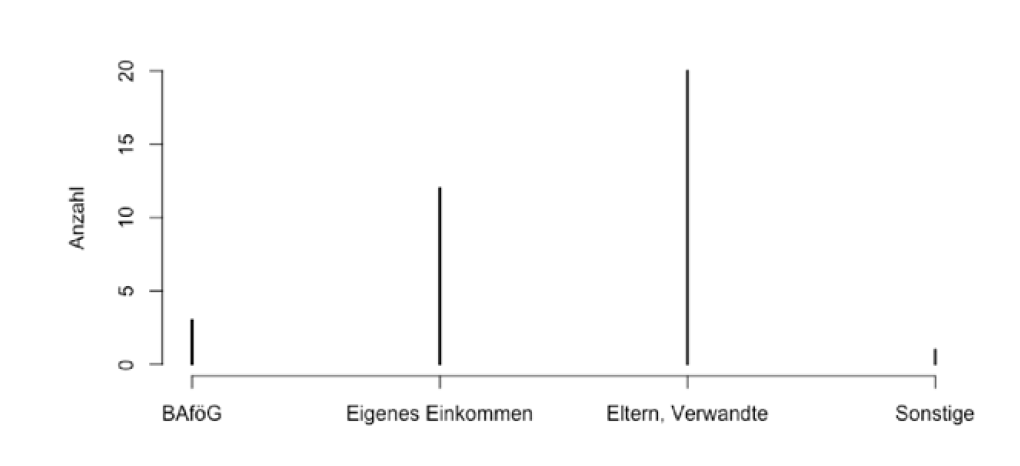
Bar diagrams 条状表
If the number \(k\) of the different realizations is small, the absolute / relative frequency distribution can be well represented by means of a bar diagram
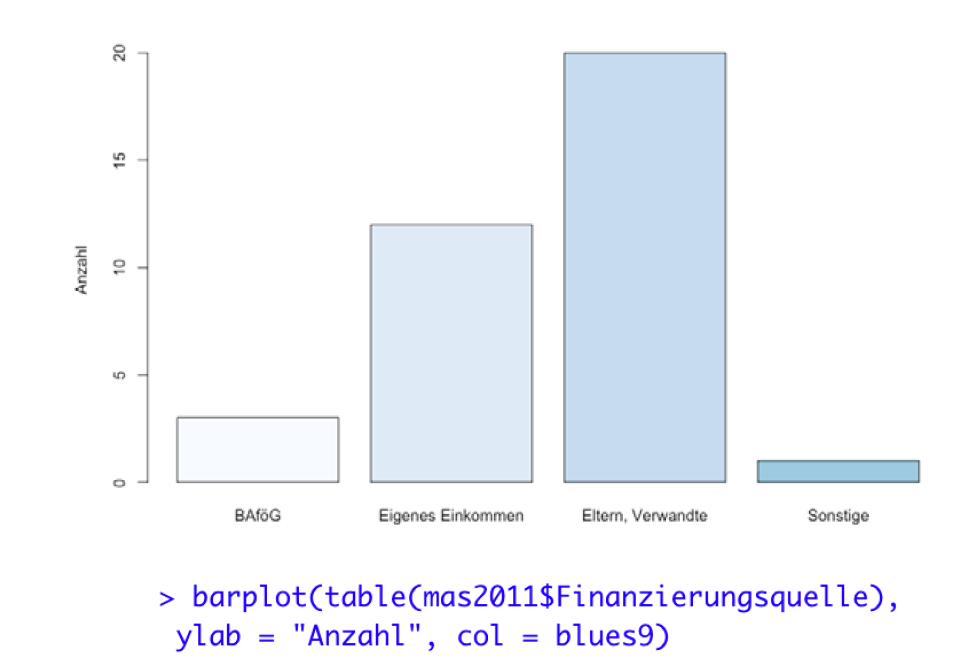
Column charts 柱状图
An often even clearer variant (also for small \(k\) ) are column charts
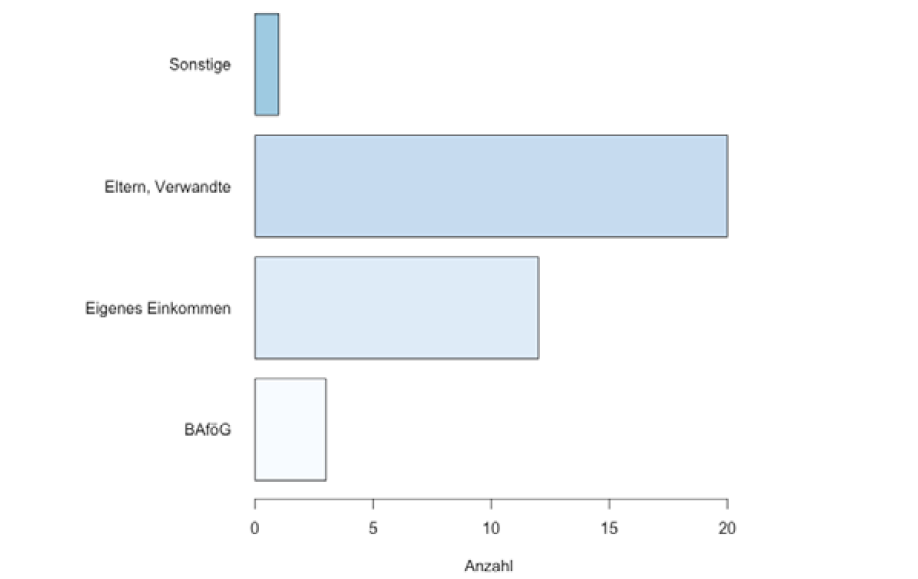
Bar chart 条状表
水平的柱状图 column chart
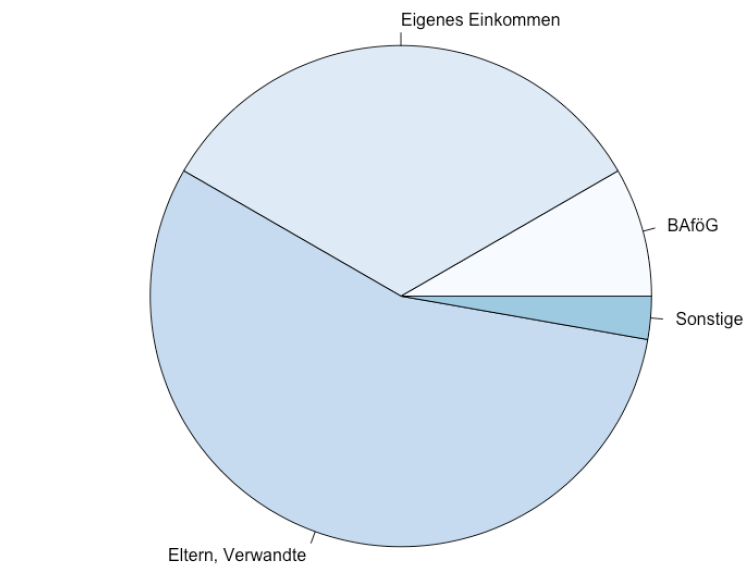
Pie charts 饼图
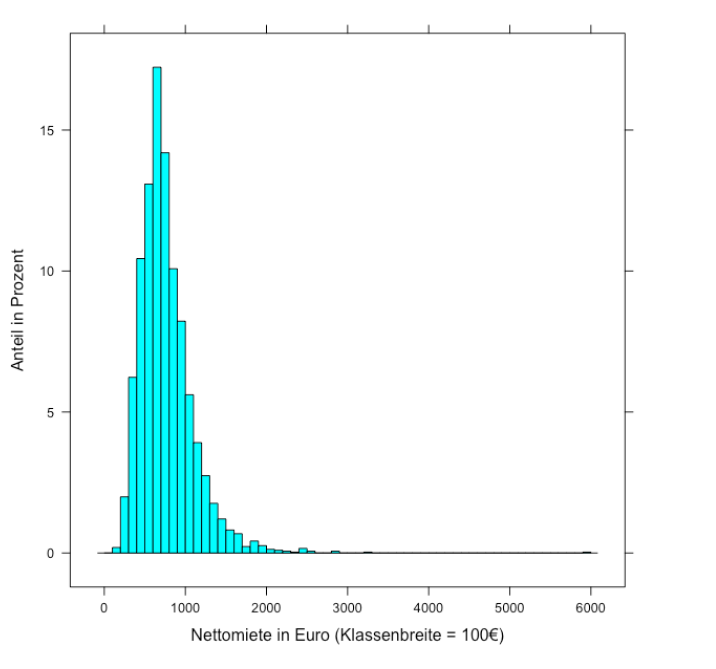
Histograms
For metric characteristics with a large number \(k\) of different expressions
累计频率分布
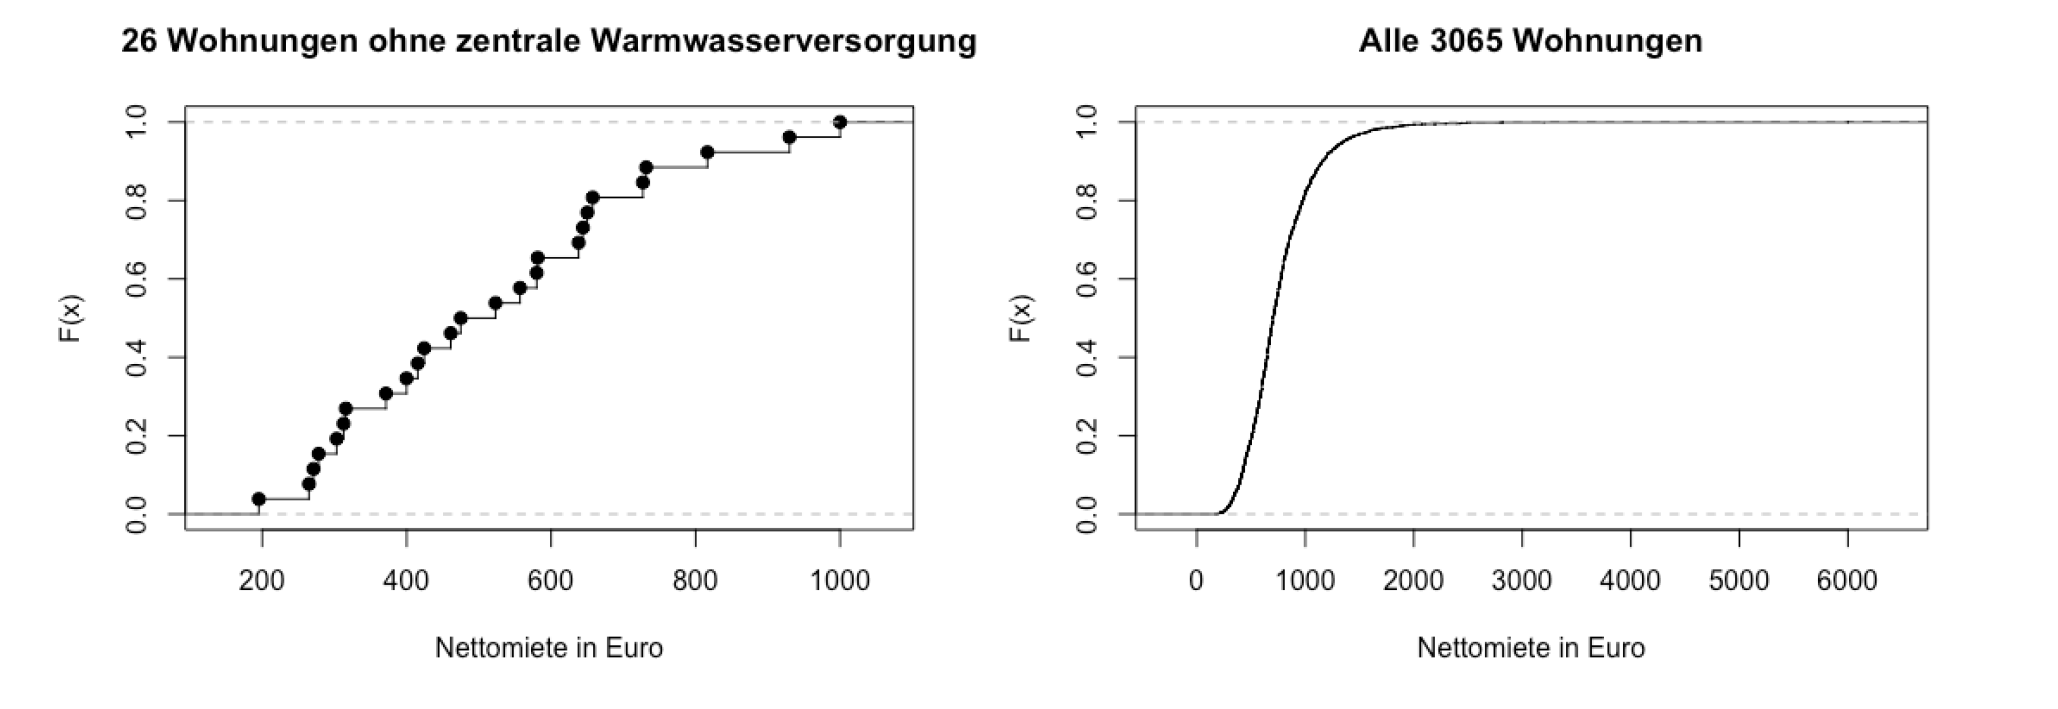
绝对累计频率分布
Absolute cumulative frequency distribution
\[ H(x)= \sum_{j:a_j \le x} h_j \]
相对累计频率分布
Relative cumulative frequency distribution
\[ F(x)=\sum_{j:a_j \le x} f_j \]
这两者的性质
- 单调递增
中心趋势测量
中心趋势
Central tendency(parameter) 是一个分布的中心值
Mode
一个简单的可以适用于所有 scale levels 的中心趋势
如果一个频率分布有唯一的最大值,那么mode 就是唯一的那个最大值,用 \(x_{mod}\) 来表示
中心趋势--平均值
arithmetic mean算数平均值
平均值
\[ \bar{x}=\frac{1}{n}\left(x_{1}+\cdots+x_{n}\right)=\frac{1}{n} \sum_{i=1}^{n} x_{i} \]
它也可以通过相对频率计算
\[ \bar{x}=a_{1} f_{1}+\cdots+a_{k} f_{k}=\sum_{j=1}^{k} a_{j} f_{j} \]
如果只有若干组的数据,也可以计算
若组为区间 \(\left[c_{0}, c_{1}\right),\left[c_{1}, c_{2}\right), \ldots,\left[c_{l-1}, c_{l}\right)\)
设 \(m_j=\frac{c_j+c_{j-1}}{2}\) , \(f_j\) 是每组的频率, 那么
\[ \bar{x}_{\text {group }}=\sum_{j=1}^{l} m_{j} f_{j} \]
Truncated mean
去掉最大值和最小值再求平均值
用 \(\bar{x}_{g}\) 表示
Winsorised means
把最小值改成次小值,最大值改成次大值,然后求平均值
用 \(\bar{x}_w\) 表示
中心趋势--中位数
设排序的列表 \(x_{(1)} \leq x_{(2)} \leq \cdots \leq x_{(n)}\) 中位数为
\[ x_{m e d}=x_\left(\frac{n+1}{2}\right) \]
如果是偶数,那么中位数不是唯一的
中线趋势-分位点
对于 \(0<p<1\), \(p\)-quantile 可以把 \(p\) 的数据和 \(1-p\) 的数据划分开来。
\(\tilde{\mathcal{X}}_{p}\) 表示那个分位点的值
重要的分位点
- 中位数 \(x_{med}= \tilde{x}_{0.5}=50\%\)-quantile
- 下四分位 Lower quartile \(\tilde{x}_{0.25}\)
- 上四分位 Upper quartile \(\tilde{x}_{0.75}\)
- 十分位 Deciles = \(10\%,20\%,..,90\%\)-quantile,
对于metric 变量
\[ d_Q= \tilde{x}_{0.75}-\tilde{x}_{0.25} \]
是 interquantile range
五点总结
加入最大值和最小值
\[ x_{\min }, \tilde{x}_{0.25}, x_{m e d}, \tilde{x}_{0.75}, x_{\max } \]
可视化:

分散性测度
Measures or parameters of dispersion(分散性) describe how far the values of a distribution spread around their centre
方差Variance
\[ \tilde{s}^{2}=\frac{1}{n}\left[\left(x_{1}-\bar{x}\right)^{2}+\cdots+\left(x_{n}-\bar{x}\right)^{2}\right]=\frac{1}{n} \sum_{i=1}^{n}\left(x_{i}-\bar{x}\right)^{2} \]
如果用频率计算
\[ \tilde{s}^{2}=\left(a_{1}-\bar{x}\right)^{2} f_{1}+\cdots+\left(a_{k}-\bar{x}\right)^{2} f_{k}=\sum_{j=1}^{k}\left(a_{j}-\bar{x}\right)^{2} f_{j} \]
标准差 Standard Deviation
\[ \tilde{s}=+\sqrt{\tilde{S}^{2}}=+\sqrt{\frac{1}{n} \sum_{i=1}^{n}\left(x_{i}-\bar{x}\right)^{2}} \]
样本方差 sample Variance
\[ s^{2}=\frac{1}{n-1}\left[\left(x_{1}-\bar{x}\right)^{2}+\cdots+\left(x_{n}-\bar{x}\right)^{2}\right]=\frac{1}{n-1} \sum_{i=1}^{n}\left(x_{i}-\bar{x}\right)^{2} \]
Coefficient of Variation
对于一个值非负的数据集且算数平均数\(\bar{x}>0\), coefficient of variation 是
\[ v=\frac{\tilde{S}}{\bar{x}} \]
Unimodal 和 Multimodal分布
Unimodal
分布只有一个唯一的峰值的分布是 Unimodal 分布

Multimodal
有多个不同的峰值

它进程出现在多个Subpopulation 的聚合
如果正好只有2个不同峰值,也叫 bimodal
对称和歪斜
对称 Symmetry
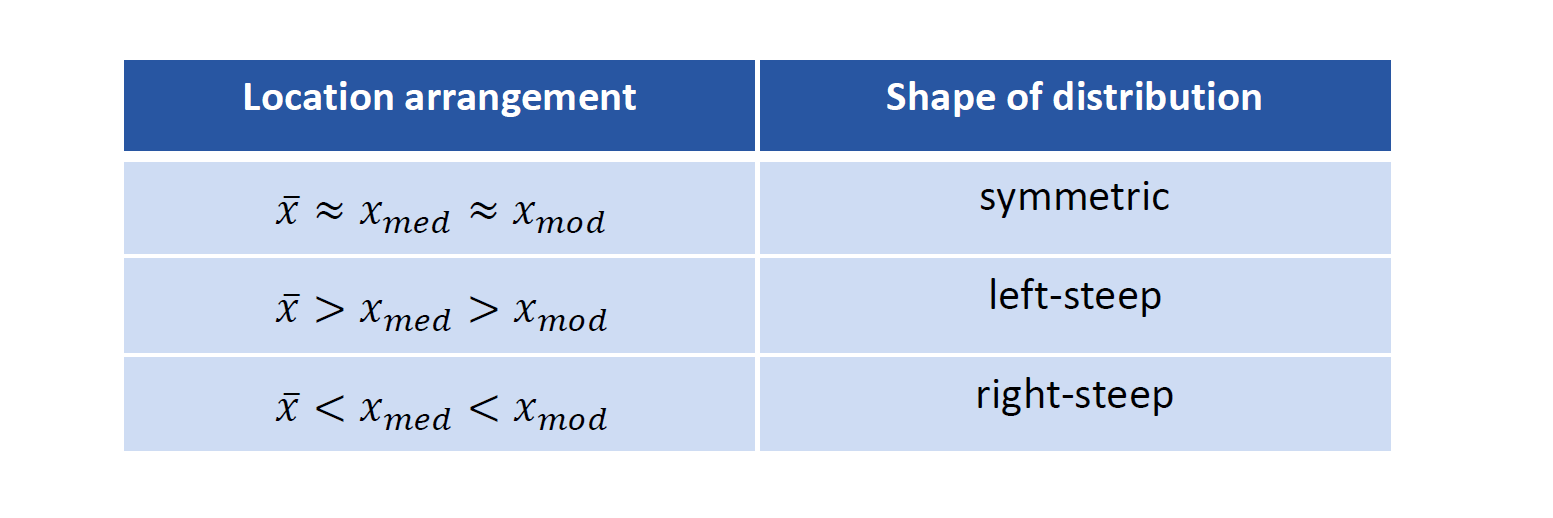
一个 unimodal 分布是对称的若存在一个对称轴
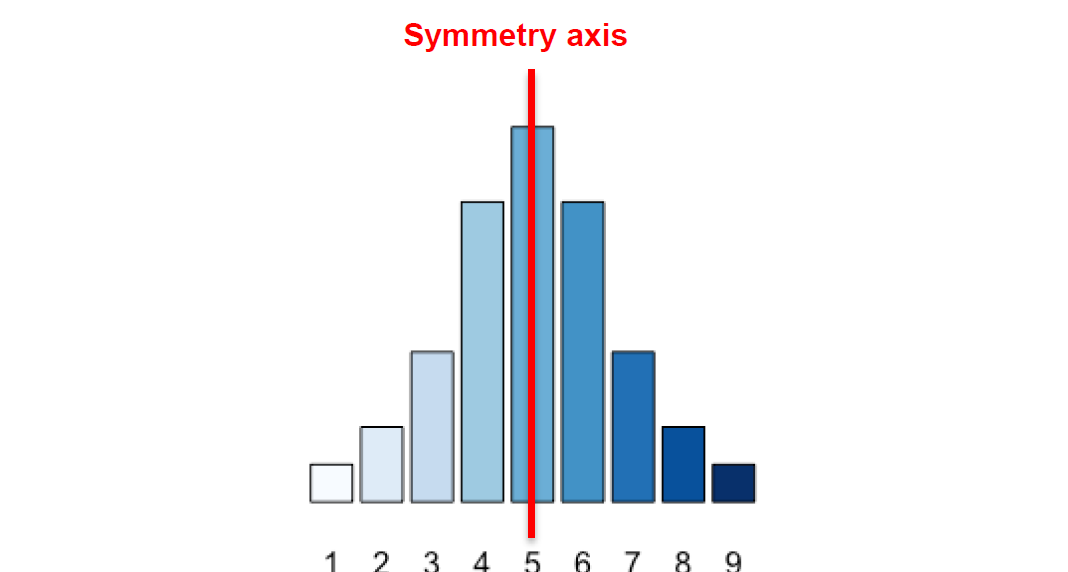
\(\bar{x} \approx x_{m e d} \approx x_{\bmod }\) 成立
明显歪斜 Clearly asymmetric
数据集中在左边: left-steep or right-skewed
数据集中在右边:right-steep or left-skewed
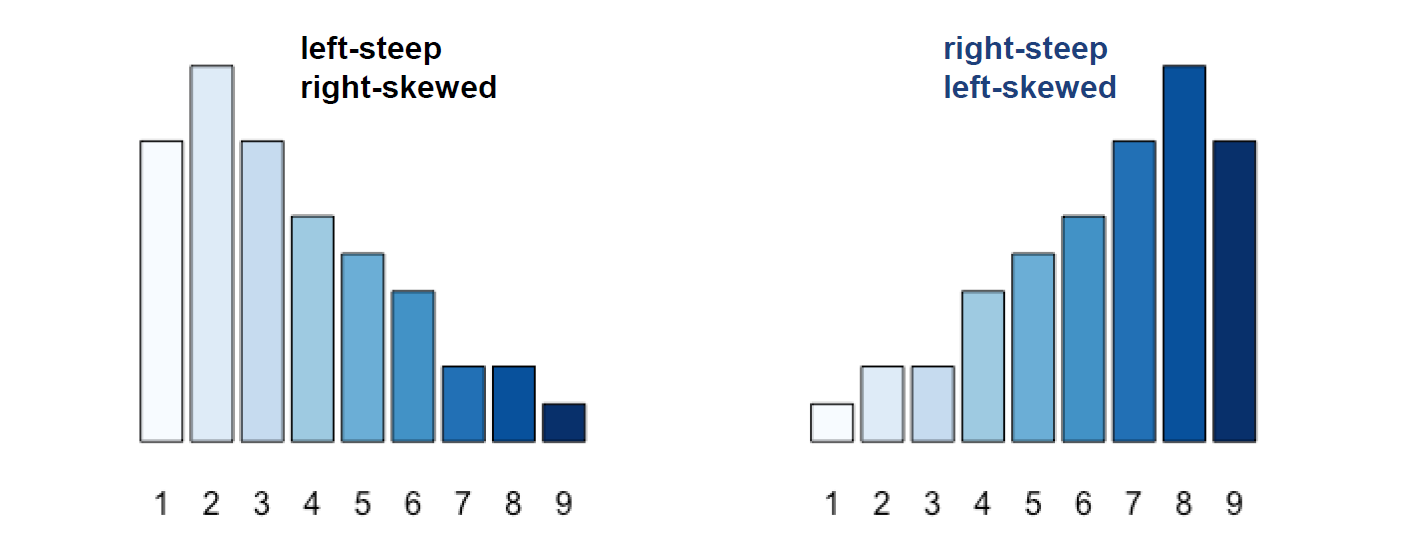
确定规则
多变量描述
Multivariate Description
对于一个统计单元有不同的变量描述,我们这里只研究2个变量的情况
Joint frequencies
联合频率
\[ h_{ij}=h(a_i, b_j) \]
可以用表格描述
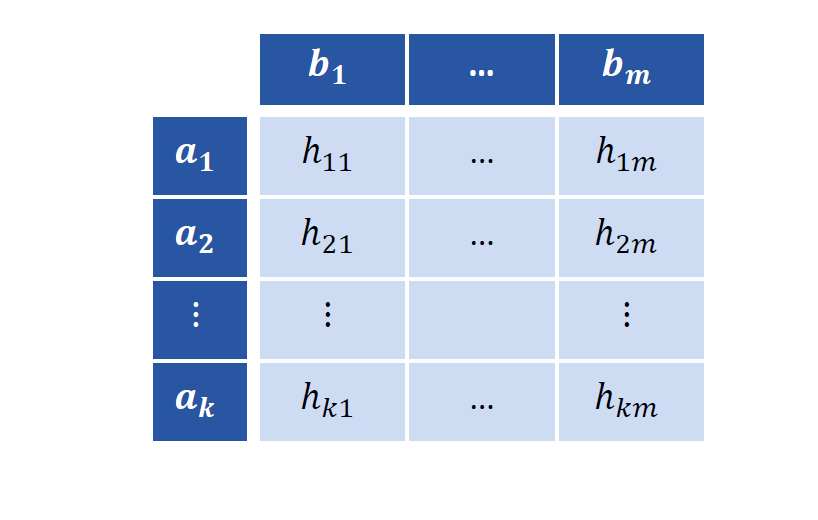
联合相对频率也类似
\[ f_{i,j}=f(a_i,b_j) \]
条件频率(Conditional Frequencies)
\[ f_{Y}(b_j | a_i) \]
是在 \(X=a_i\) 的条件下, \(b_j\) 是 \(Y\) 的频率
对于 \(f_X\) 也是类似定义的
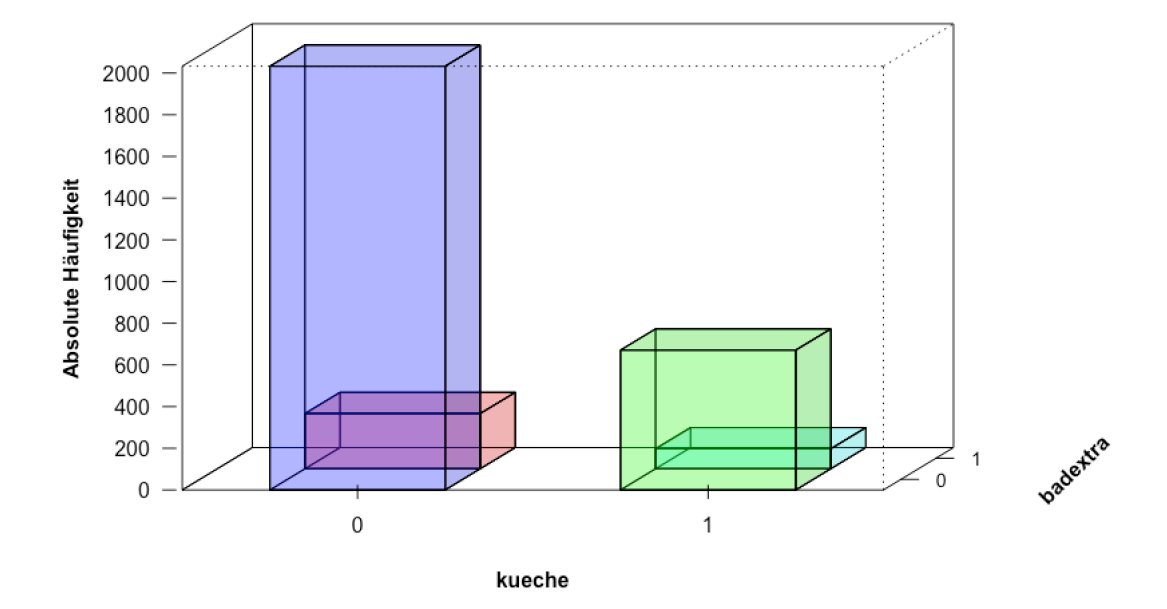
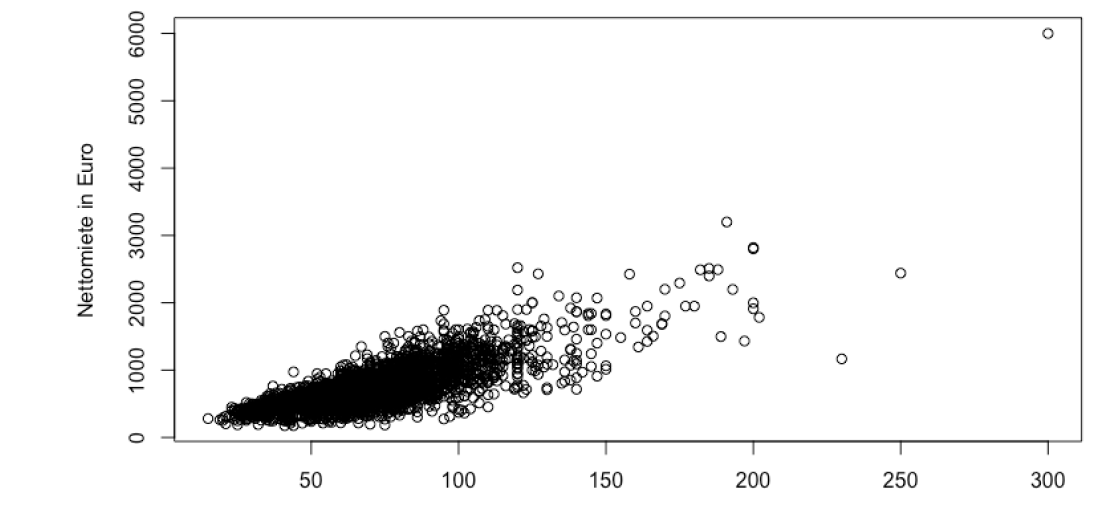
二维图表
二维条状图
two-dimensional bar chart
二维Scatter Plots
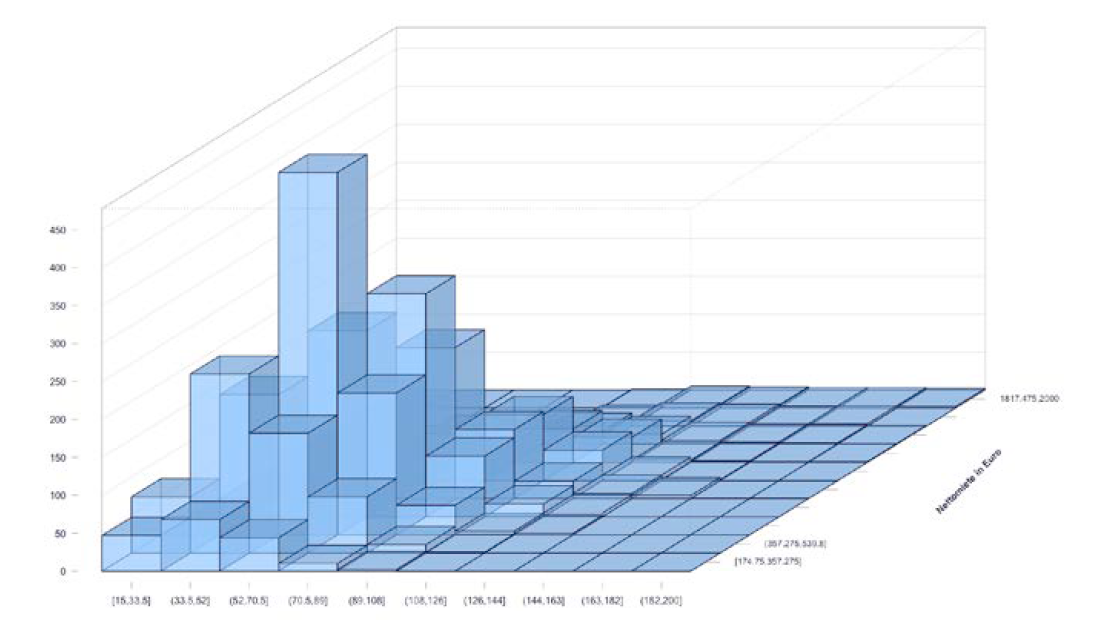
二维 Histograms
Correlation 相互关系测量
Monotonic correlation
- same-sence relation: 如果 \(X\) 变大,那么 \(Y\) 也变大
- opposite-sense relation: 如果 \(X\) 变小,那么 \(Y\) 变小
Metric, Ordinal 变量
Functional correlation
- linear relation
- quadratic relationships
Metric 变量
连续性和 \(\chi^2\) 系数
\(\chi^2\) 系数
\[ \chi^{2}=\sum_{i=1}^{k} \sum_{j=1}^{m} \frac{\left(h_{i j}-\frac{h_{i} \cdot h_{\cdot j}}{n}\right)^{2}}{\frac{h_{i} \cdot h_{\cdot j}}{n}} \in[0, \infty) \]
如果 \(\chi^2\) 小,那么这两个变量没有关系,如果大那么这两个变量有关系
连续系数
\[ \begin{aligned} K &=\sqrt{\frac{\chi^{2}}{n+\chi^{2}}} \in\left[0, K_{\max }\right] \\ \text { where } K_{\max } &=\sqrt{\frac{M-1}{M}} \text { with } M=\min \{k, m\} \end{aligned} \]
纠正的连续系数 corrected Contingency Coefficient
\[ K^{*}=\frac{K}{K_{\max }} \in[0,1] \]
如果
\[ K^* =0 \]
那么
\(X,Y\)
无关
若
\[ K^*=1 \]
那么
\(X,Y\)
有关
经验协方差Empirical Covariance
\[ \tilde{s}_{X Y}=\frac{1}{n} \sum_{i=1}^{n}\left(x_{i}-\bar{x}\right) \cdot\left(y_{i}-\bar{y}\right) \]
Bravais-Pearson Correlation Coefficient
\[ r=r_{X Y}=\frac{\tilde{S}_{X Y}}{\tilde{s}_{X} \cdot \tilde{S}_{Y}}=\frac{\sum_{i=1}^{n}\left(x_{i}-\bar{x}\right) \cdot\left(y_{i}-\bar{y}\right)}{\sqrt{\sum_{i=1}^{n}\left(x_{i}-\bar{x}\right)^{2} \sum_{i=1}^{n}\left(y_{i}-\bar{y}\right)^{2}}} \]
更加快捷的计算公式:
\[ r=r_{X Y}=\frac{\sum_{i=1}^{n} x_{i} y_{i}-n \bar{x} \bar{y}}{\sqrt{\left(\sum_{i=1}^{n} x_{i}^{2}-n \bar{x}^{2}\right)\left(\sum_{i=1}^{n} y_{i}^{2}-n \bar{y}^{2}\right)}} \]
这个系数可以测量线性关系的强度
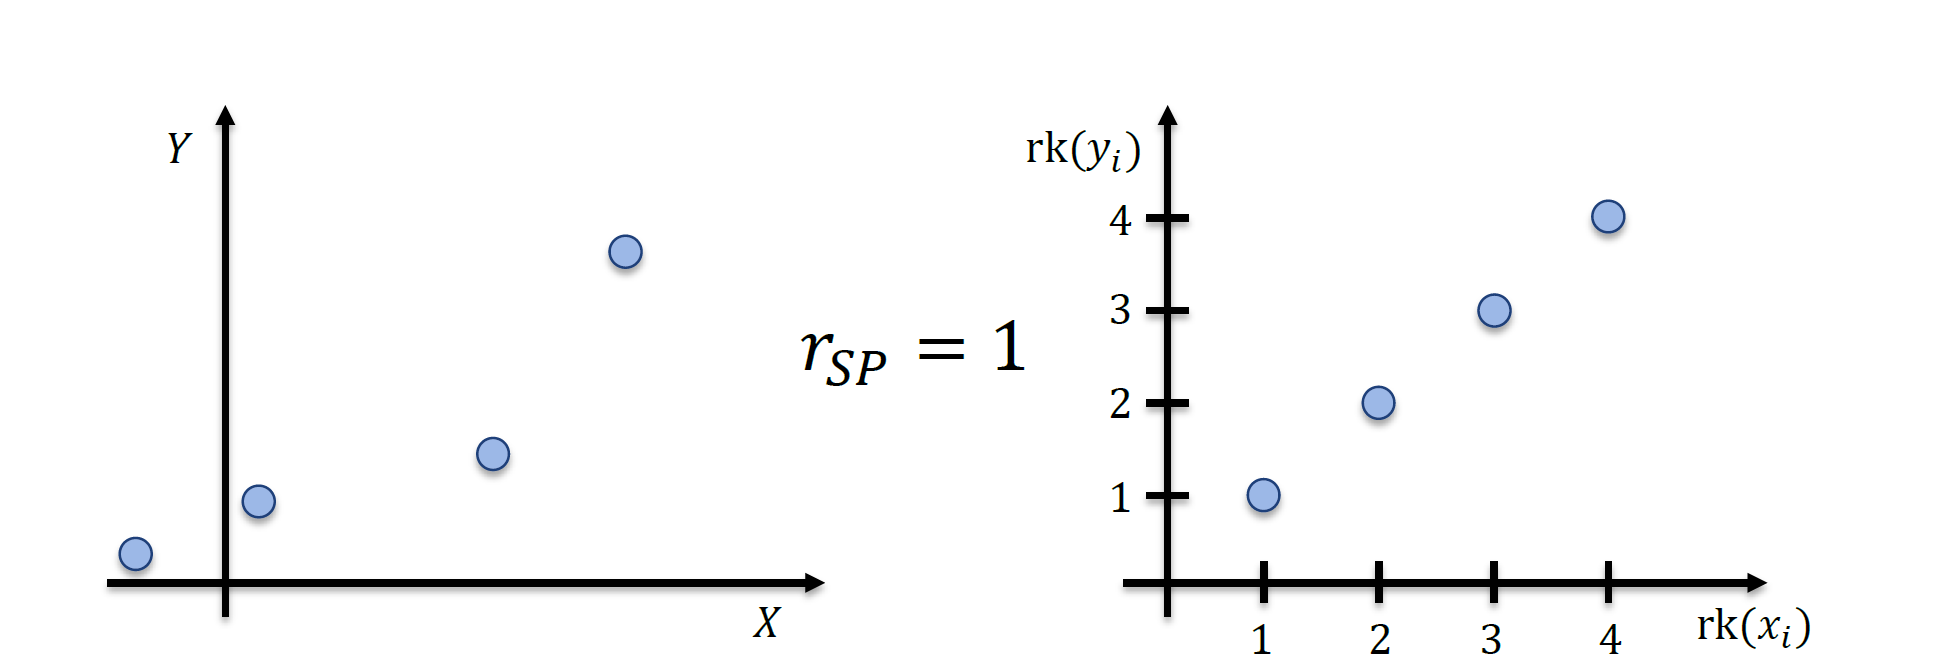
Spearman‘s(Rank) Correlation Coefficient
排名Ranks
\[ \begin{array}{|l|c|c|c|c|c|} \hline \text { Person } i & 1 & 2 & 3 & 4 & 5 \\ \hline \text { Element } x_{i} & 1.57 \mathrm{~m} & 1.70 \mathrm{~m} & 1.83 \mathrm{~m} & 1.65 \mathrm{~m} & 1.75 \mathrm{~m} \\ \hline \text { Rank } \operatorname{rk}\left(x_{i}\right) & 1 & 3 & 5 & 2 & 4 \\ \hline \end{array} \]
Spearman‘s(Rank) CorrelationCoefficient
\[ r_{S P}=\frac{\sum_{i=1}^{n}\left(\operatorname{rk}\left(x_{i}\right)-\overline{\mathrm{rk}}_{X}\right) \cdot\left(\operatorname{rk}\left(y_{i}\right)-\overline{\mathrm{rk}}_{Y}\right)}{\sqrt{\sum_{i=1}^{n}\left(\operatorname{rk}\left(x_{i}\right)-\overline{\mathrm{rk}}_{X}\right)^{2} \sum_{i=1}^{n}\left(\operatorname{rk}\left(y_{i}\right)-\overline{\mathrm{rk}}_{Y}\right)^{2}}} \]
更快速的计算方式:
若 \(x_i \ne x_j,y_i \ne y_j\) , 设 \(d_{i}=\operatorname{rk}\left(x_{i}\right)-\operatorname{rk}\left(y_{i}\right)\)
\[ r_{S P}=1-\frac{6 \sum_{i=1}^{n} d_{i}^{2}}{\left(n^{2}-1\right) n} \]
这个系数可以测量递增关系的强度 strength of the monotonic relationship
线性回归
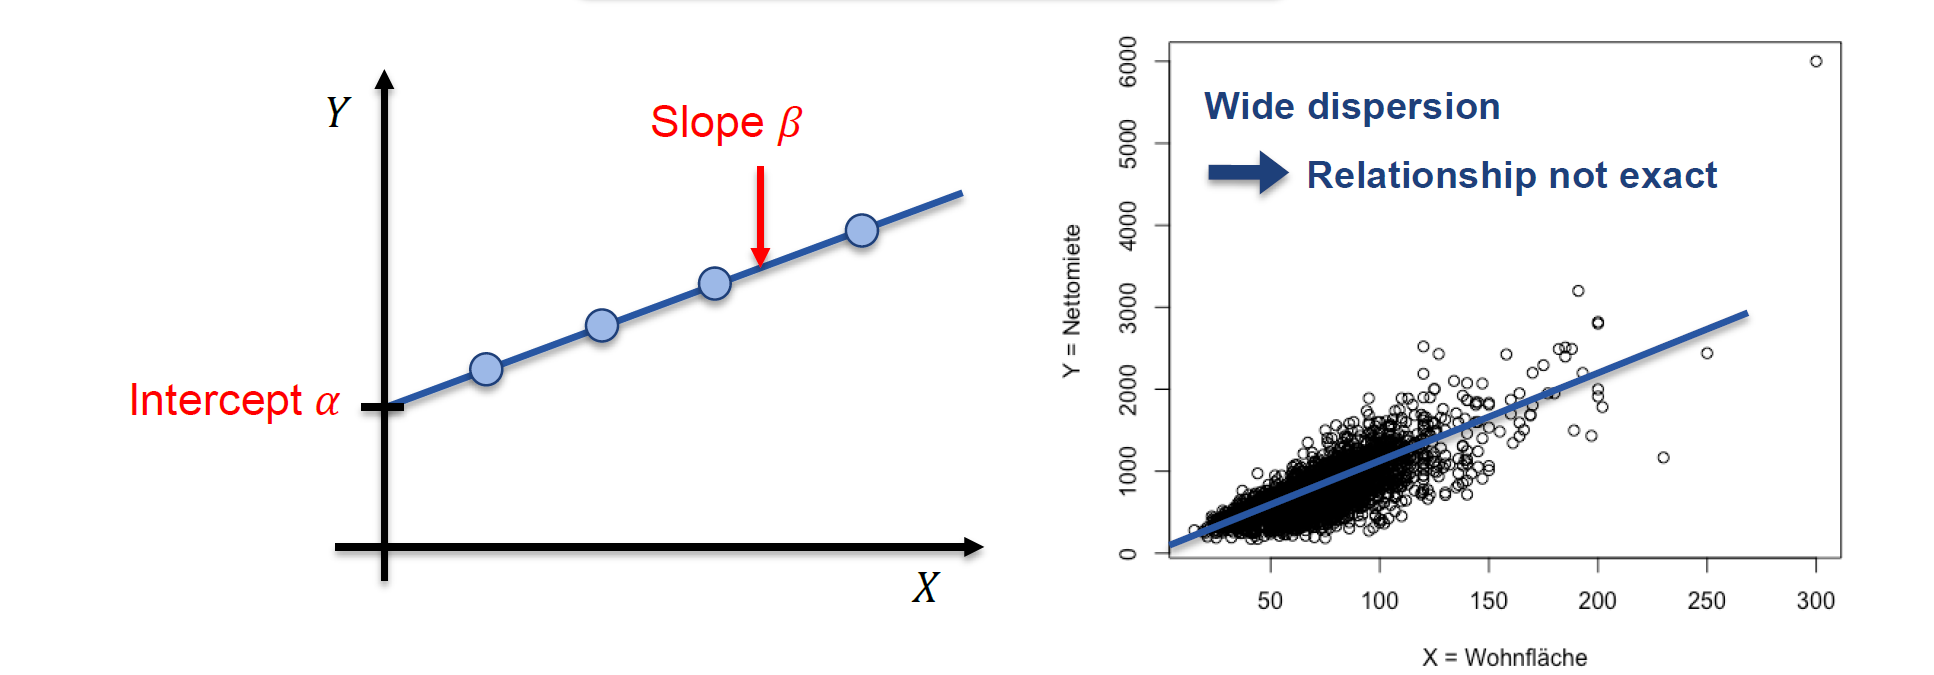
用线性函数描述 \(X,Y\) 关系
\[ Y=f(X)=\alpha + \beta X, \alpha, \beta \in \R \]
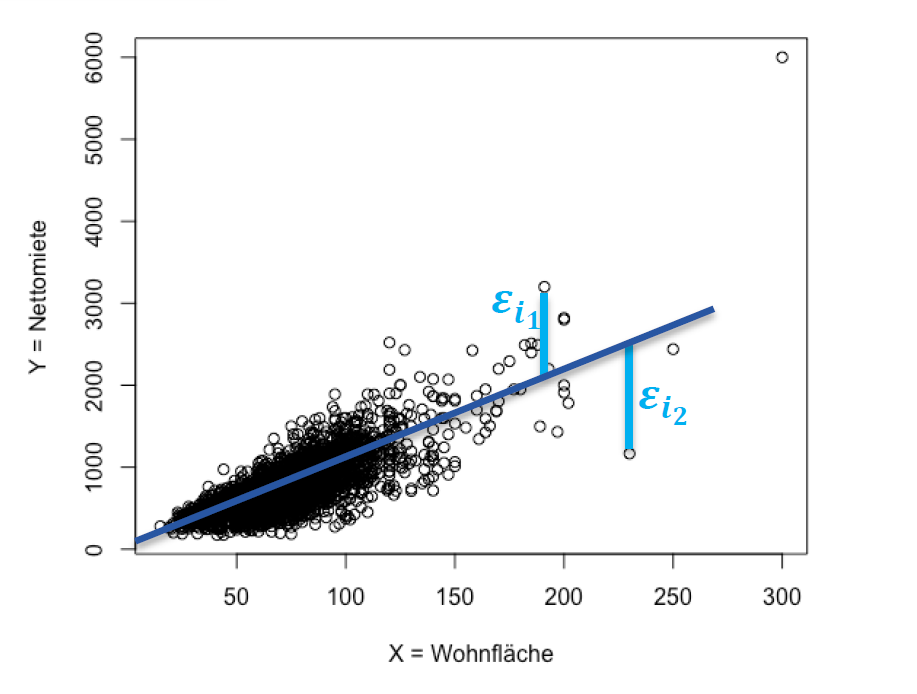
允许误差 \(\epsilon _i\)
\[ y_{i}=f\left(x_{i}\right)+\epsilon_{i}=\alpha+\beta x_{i}+\varepsilon_{i}, \quad i=1, \ldots, n \]
Method of Least Squares
设 \(\varepsilon_{i}=y_{i}-\hat{y}_{i}\) 最小化 \(\varepsilon_{i}^{2}=\left(y_{i}-\hat{y}_{i}\right)^{2} \geq 0\)
\[ \min Q(\alpha, \beta)=\frac{1}{n} \sum_{i=1}^{n}\left(y_{i}-\hat{y}_{i}\right)^{2}=\frac{1}{n} \sum_{i=1}^{n}\left[y_{i}-\left(\alpha+\beta x_{i}\right)\right]^{2} \]
我们可以令偏导数为 \(0\) 来最小化
\[ \begin{gathered} \frac{\partial Q(\alpha, \beta)}{\partial \alpha}=-\frac{2}{n} \sum_{i=1}^{n}\left[y_{i}-\left(\alpha+\beta x_{i}\right)\right]=0 \\ \frac{\partial Q(\alpha, \beta)}{\partial \beta}=-\frac{2}{n} \sum_{i=1}^{n}\left[y_{i}-\left(\alpha+\beta x_{i}\right)\right] \cdot x_{i}=0 \end{gathered} \]
于是得出
\[ \begin{gathered} \hat{\alpha}=\bar{y}-\hat{\beta} \bar{x} \\ \hat{\beta}=\frac{\sum_{i=1}^{n} y_{i} x_{i}-n \bar{y} \bar{x}}{\sum_{i=1}^{n} x_{i}^{2}-n \bar{x}^{2}}=\frac{\sum_{i=1}^{n}\left(x_{i}-\bar{x}\right)\left(y_{i}-\bar{y}\right)}{\sum_{i=1}^{n}\left(x_{i}-\bar{x}\right)^{2}}=\frac{\tilde{s}_{X Y}}{\tilde{s}_{X}^{2}} \end{gathered} \]
Coefficient of Determination and Residual Analysis
total dispersion(Sum of Square Total)
\[ S Q T=\sum_{i=1}^{n}\left(y_{i}-\bar{y}\right)^{2}\left(=n \cdot \tilde{S}_{Y}^{2}\right) \]
分解分散性 Dispersion Decomposition
\[ \begin{gathered} S Q T=S Q E+S Q R \\ \sum_{i=1}^{n}\left(y_{i}-\bar{y}\right)^{2}=\sum_{i=1}^{n}\left(\hat{y}_{i}-\bar{y}\right)^{2}+\sum_{i=1}^{n}\left(y_{i}-\hat{y}_{i}\right)^{2} \end{gathered} \]
Coefficient of Determination
描述一个模型的质量
\[ R^{2}=\frac{\text { explained dispersion }}{\text { total dispersion }}=\frac{S Q E}{S Q T}=\frac{\sum_{i=1}^{n}\left(\hat{y}_{i}-\bar{y}\right)^{2}}{\sum_{i=1}^{n}\left(y_{i}-\bar{y}\right)^{2}} \]
另一个公式:
\[ R^{2}=1-\frac{S Q R}{S Q T}=1-\frac{\sum_{i=1}^{n}\left(y_{i}-\hat{y}_{i}\right)^{2}}{\sum_{i=1}^{n}\left(y_{i}-\bar{y}\right)^{2}} \]
\(0 \le R^2 \le 1\) , 若 \(R^2=0\) 说明坏,\(R^2=1\) 说明好
概率演算Probability Calculus
略
Statistical inference
点估计
我们需要估计一个分布的未知参数 \(\theta\)
为了实现,我们设 \(X_1,...X_n\) 是独立的且相同的分布
估计函数
对于一个参数的估计函数是:
\[ T=g\left(X_{1}, \ldots, X_{n}\right) \]
下面是数理统计的知识,略
R语言
安装
下载安装:https://cran.r-project.org/
下载 RStudio https://www.rstudio.com/
下载额外包裹
在 R Console 里面
先选择一个比较快的源
1
chooseCRANmirror()
然后安装包
1
install.packages("name", dependencies = TRUE)
这个学期需要用到的包
ggplot2latticerobustHDepadevcdgplotsTeachingDemos
基础语法
运算符
+,-,*,/,^ : 加减乘除(浮点数除法)次幂
变量赋值
1 | x <- 13 |
删除变量
1 | rm(x) |
函数
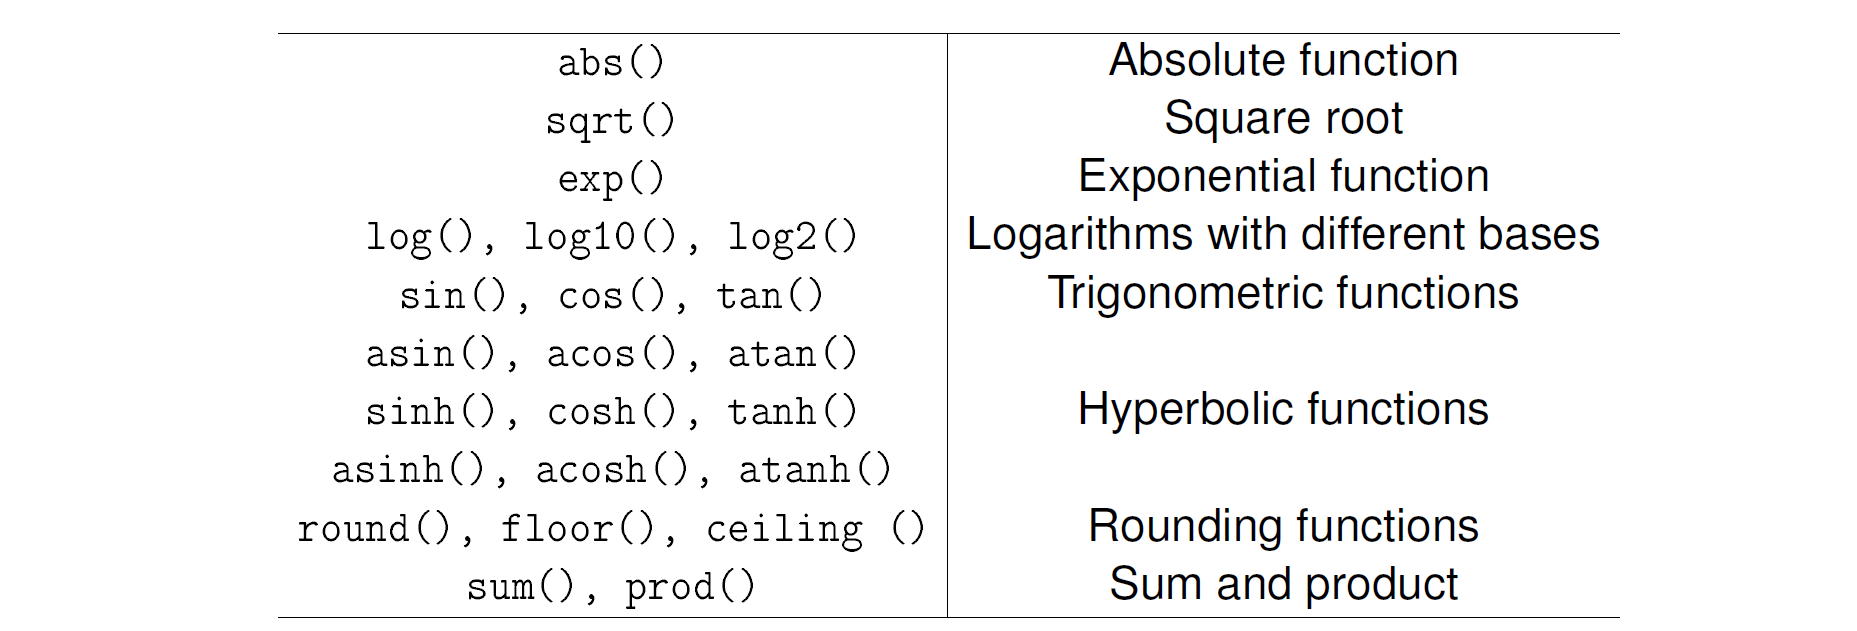
库函数
sqrt(2)开平方根sum(1,3,4)求和
数据类型

vector
按类型长度生成
生成长度为 10 类型为 numeric 的列表
1 | x <- vector(mode="numeric", length=10) |
使用 c() 生成
直接赋值
1 | c(1,0,2,4) |
取index
1 | x[10] # index 1 .. 10 |
数组越界会报错:NA
给每个值取名字
1 | x <- c(Monday=1,Tuesday=2) |
Matrices
生产 3行 2列数据从10到15按行递增的矩阵
1 | a = matrix(nrow=3, ncol=2, data=10:15, byrow=T) |
取元素
取出第3行第2列的元素
1 | a[3,2] |
取出第3行
1 | a[3,] |
数据集Data Set
1 | Age = c(21, 22, 23)Gender = c("m", "w", "m")x = data.frame(Age, Gender) |
也可加入名字
1 | names = c("Tom", "Kite", "Lisa")x = data.frame(Age, Gender, row.names = names) |
提取部分数据
subset
1 | women = subset(x, x$Gender == "w") |
split
1 | a = split(x, x$Gender)a[1]a[2] |
数据集
更改目录
1 | getwd() # 显示当前目录setwd("D:/Fyind") # 设置目录 |
读取数据
1 | t = read.table(".../a.csv",sep=";",header = TRUE)t = read.table(".../a.csv",sep=";",header = TRUE, row.names=1) # 第1列作为行的名字 |
用read_csv读取数据表
1 | install.packages("tidyverse") |
写入数据
1 | write.table(x, "x.csv", sep=";") |
函数
查看维度
1 | dim(x) |
查看数据表
1 | View(x) |
选择数据
1 | Age <- 0:120Age <- seq(0, 120, 1) # 从 0 到 120 步长 1 的数组AgeGrouped <- cut(Age, breaks = c(0,13,19,65,120)) # 分割出区间 (0,13], (13,19] ... AgeGrouped <- cut(Age, breaks = c(0,13,19,65,120), include.lowest = TRUE) # 包含第1个元素AgeGrouped <- cut(Age, breaks = c(0,13,19,65,Inf), right = FALSE) # 左闭右开AgeGrouped <- cut(Age, breaks = c(0,13,19,65,65, Inf), right = FALSE, labels = c("Children","Teenagers","Adults","seniors")) # 添加标签 |
- 选择某几列
1 | LAozone_small = LAozone[, c("ozone", "temp")] # 选择了ozone 和 temp 列 |
生成频率列表
1 | table(x) # 单个变量table(MunichGraduate$Finanzierungsquelle,MunichGraduate$Studiendauer) # 双变量 |
生成相对频率列表
1 | prop.table(table(x)) |
使用拓展包
1 | library(lattice) |
求统计值
求最大值的行
1 | which.max(CoronaBavaria$Infektionen)CoronaBavaria[59, ] # 取出第59行 |
求平均数
1 | MeanCoronaCounty <- mean(CoronaCounty$Infektionen.pro.100.000.Einwohner) |
求中位数
1 | MedianCoronaBavaria <- median(CoronaBavaria$Infektionen.pro.100.000.Einwohner) |
求五点总结
1 | summary(CoronaCounty$Infektionen.pro.100.000.Einwohner) |
求边界加和
1 | addmargins(table(MunichGraduate$Finanzierungsquelle,MunichGraduate$Studiendauer)) # 生成加和 |
加入列:根据10 quantile来统计
1 | library(mltools)CoronaCounty[,"InfectionsPer100000_grouped"]<- bin_data(CoronaCounty$Infektionen.pro.100.000.Einwohner, bins=10, binType="quantile") |
求 \(\chi^2\) 参数,contingency coefficient
1 | library(vcd)assocstats(table(CoronaCounty$Bundesland, CoronaCounty$InfectionsPer100000_grouped)) |
求 Bravais-Pearson correlation coefficient
1 | storksPerHectare <- c(20, 30, 40, 50, 60, 70) # x 轴birthsPerThousand <- c(13, 24, 43, 51, 57, 77) # y 轴cor(storksPerHectare, birthsPerThousand, method = "pearson") |
画表格
生成 histogram
1 | library(lattice)histogram(NewerFlats$wfl, breaks = seq(0,320,10), xlab = "Living space in sqm (class width = 10 sqm)", ylab = "Proportion in percentage", right = FALSE) |
盒子五点总结
1 | boxplot(CoronaCounty$Infektionen.pro.100.000.Einwohner, horizontal = TRUE, xlab = "Infections per 100 000 inhabitants", main = "Data set Corona County", range = 0) |
画图像
1 | storksPerHectare <- c(20, 30, 40, 50, 60, 70) # x 轴birthsPerThousand <- c(13, 24, 43, 51, 57, 77) # y 轴plot(storksPerHectare,birthsPerThousand, main = "Scatter plot Number of storks per hectare vs. Number of births per thousand inhabitants", xlab = "Number of storks per hectare", ylab = "Number of births per thousand inhabitants", pch = 19) |
画正态分布
1 | curve(dnorm(x, 0, 1), from=-5, to=5, ylab = expression(varphi(x)))par(mfrow=c(2,2)) # 画4张图(2*2)curve(dnorm(x, 0, sqrt(0.25)), from=-5, to=5, ylab = expression(varphi(x)), main = expression(sigma^2==0.25))curve(dnorm(x, 0, sqrt(1)), from=-5, to=5, ylab = expression(varphi(x)), main = expression(sigma^2==1.0))curve(dnorm(x, 0, sqrt(2)), from=-5, to=5, ylab = expression(varphi(x)), main = expression(sigma^2==2.0))curve(dnorm(x, 0, sqrt(5)), from=-5, to=5, ylab = expression(varphi(x)), main = expression(sigma^2==5.0)) |
画条状图
1 | ShoeSize <- c(40, 44, 42, 41, 44, 41, 43, 42, 43, 43, 43, 42, 42, 42, 41, 40, 41, 44, 39, 45)barplot(table(ShoeSize), col = blues9, xlab = "ShoeSize", ylab = "Quantities (abs. Frequencies)") |
假设检验
T-Test
1 | t.test(ShoeSize, conf.level = 0.95) |
Sigma-Test
1 | library(TeachingDemos)sigma.test(ShoeSize, conf.level = 0.95) |


